

On the 4th of March, 2021 the Central Bureau of Statistics rebased its National Accounts Statistics. This is the fifth time that CBS has changed its base year of National Accounts Statistics. This means that CBS changed the base year for the calculation of the Gross Domestic Product (GDP) from 2000/01 to 2010/11. As a result of rebasing, the GDP of Nepal in FY 2019/20 becomes Rs. 3943.7 billion which is a 5 percent increase as compared to the amount of GDP based on an old base year.
Meaning of Rebasing
Rebasing the National Accounts is the task of replacing the existing or old base year considered in the calculation of the current National Accounts with a new and more recent base year for computing constant price estimates. This is considered as an opportunity to address the limitations regarding methodology, definitions, and source of data. A most important feature of rebasing is that it does not change any economic facts rather it measures them better. Similarly rebasing the measure of national accounts makes it a more reliable measure of economic structure and growth and ensures more timely and informed economic policy decisions.
Objectives of Rebasing
- To implement the recommendations of 2008 Systems of National Accounts (2008 SNA)
- To adopt a new classification of economic activities as per International Standards Industrial Classification-ISIC rev, 4.0, CPC 2.0
- To increase the coverage of economic activities by including new economic undertakings
- To adopt a new methodology for computing GDP.
- To ensure more timely and informed economic policy decisions
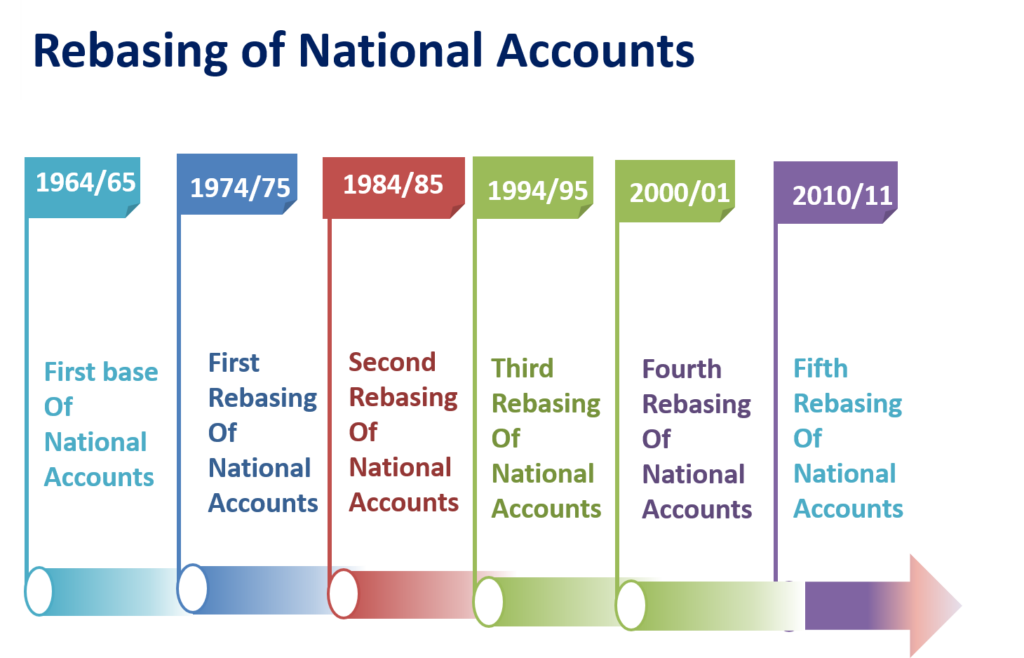
History of Rebasing in Nepal
This is the fifth time that CBS has changed the base year started from 1964/65 as the first base year of National Accounts. The rebasing history of the National Account is shown below.
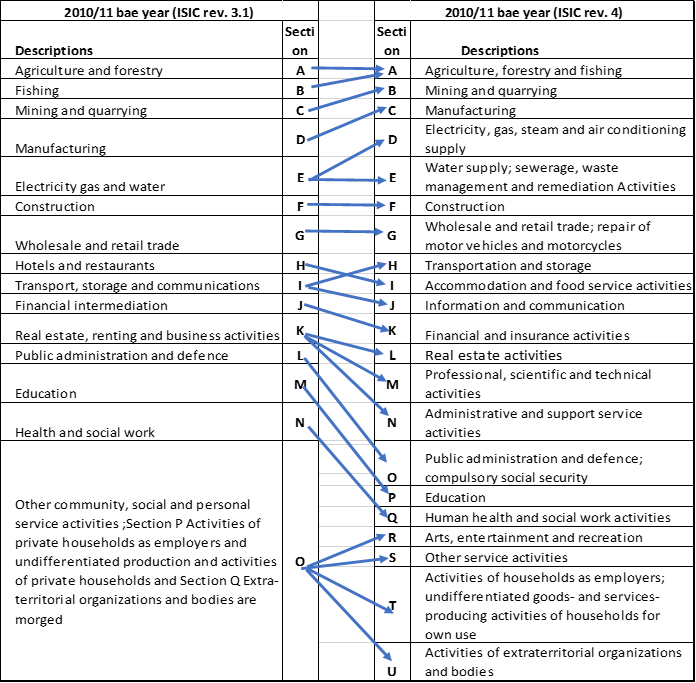
Implementation of International Standards Industrial Classification (ISIC)
As a result of the implementation of ISIC rev, 4 the subsectors of the economy are reformed. Subsectors are increased from 15 to 18 as shown below.
Results of Rebasing and Revisions of the GDP for 2019/20
The obtained results from rebasing the base year from 2000/01 to 2010/11 are shown with the help of the following graphs.
Change in Gross Value Added or Gross Domestic Product
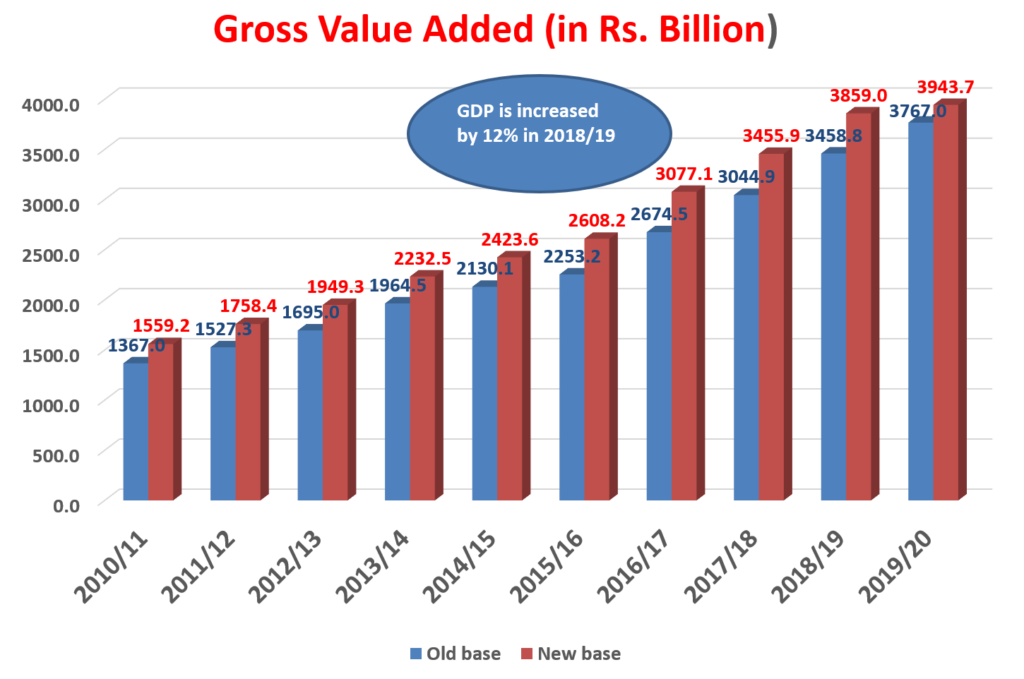
As shown in the above graph, the GDP of the base year increases from Rs. 1367.0 billion to Rs. 1559.2 billion (14.1 % increase). Similarly, the GDP of FY 2019/20 is increased by 5 percent from Rs. 3767.0 billion to Rs. 3943.7 billion.
Change in GDP Growth Rate at Basic Price
The following graph shows the change in the GDP growth rate at the basic price by changing the base year.
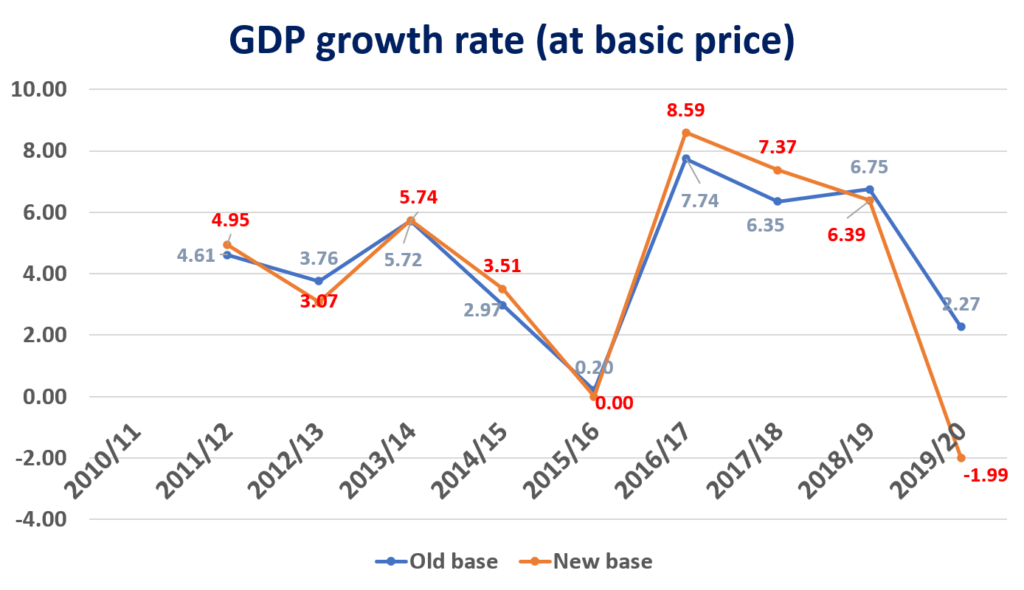
As shown in the graph, the GDP growth rate of Nepal for FY 2019/20 with new base year 2010/11 is negative (-1.99 %) and was estimated to be 2.27 % based on the old base year 2000/01. This shows that the economy of Nepal contracted by 1.99 percent in 2019/20 as a result of COVID-19 lockdowns.
Change in GDP Growth Rate at Purchaser Price
The following graph shows the change in the GDP growth rate at market price by changing the base year.
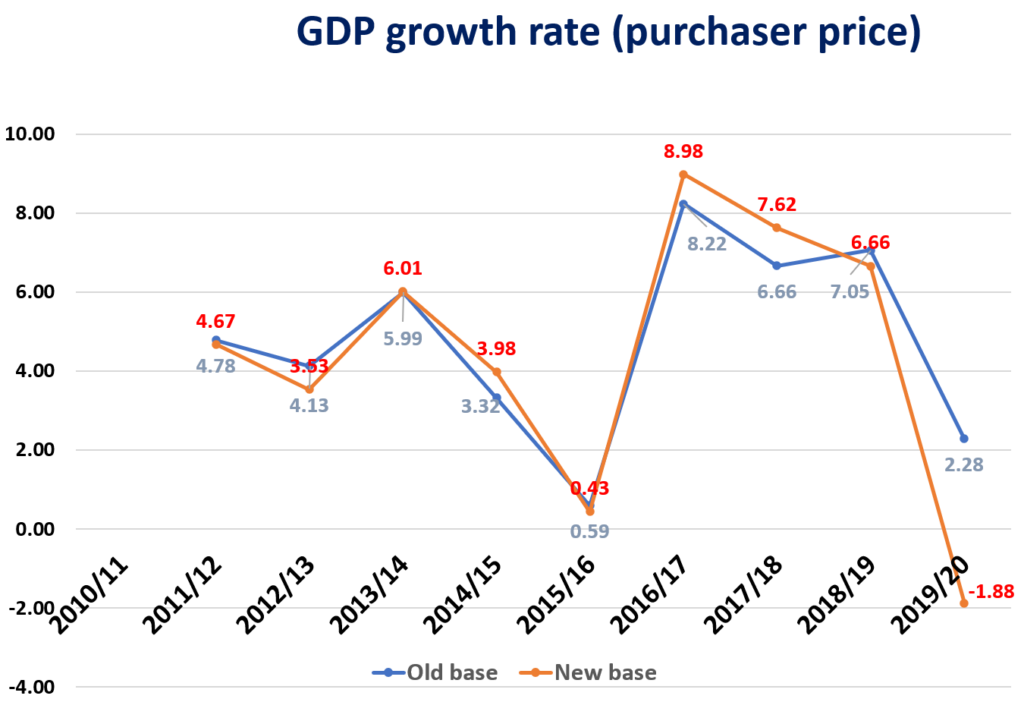
As shown in the graph, the GDP growth rate of Nepal for FY 2019/20 with new base year 2010/11 is negative (-1.88 %) and was estimated to be 2.28 % based on the old base year 2000/01. This shows that the economy of Nepal contracted by 1.88 percent at market price.
Change in Nominal Per Capita GDP (In the US$)
The following graph shows the change in the per capita GDP in the USD with the change in the base year.
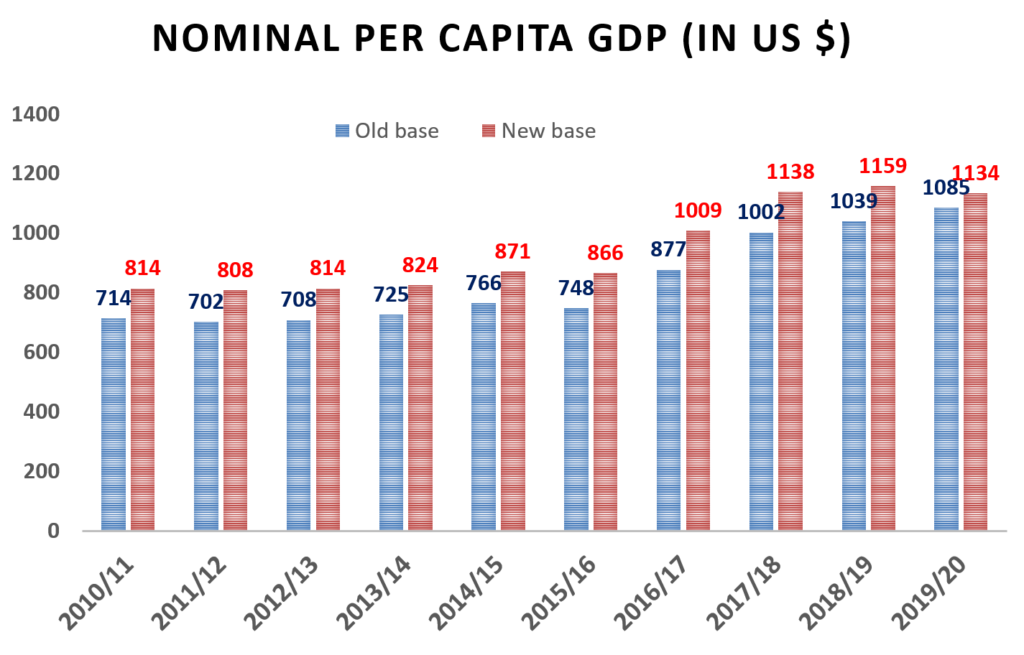
As shown in the above graph, nominal per capita GDP in the new base year has increased from 714 USD to 814 USD. In FY 2019/20 also the GDP per capita has increased from 1085 USD to 1134 USD.
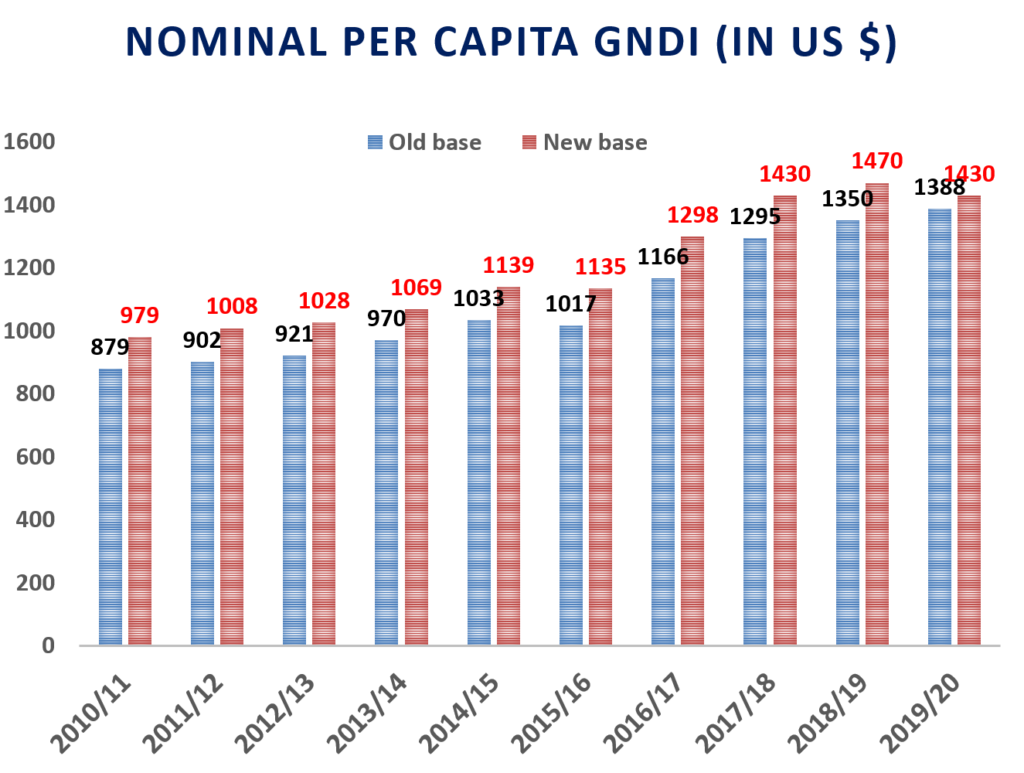
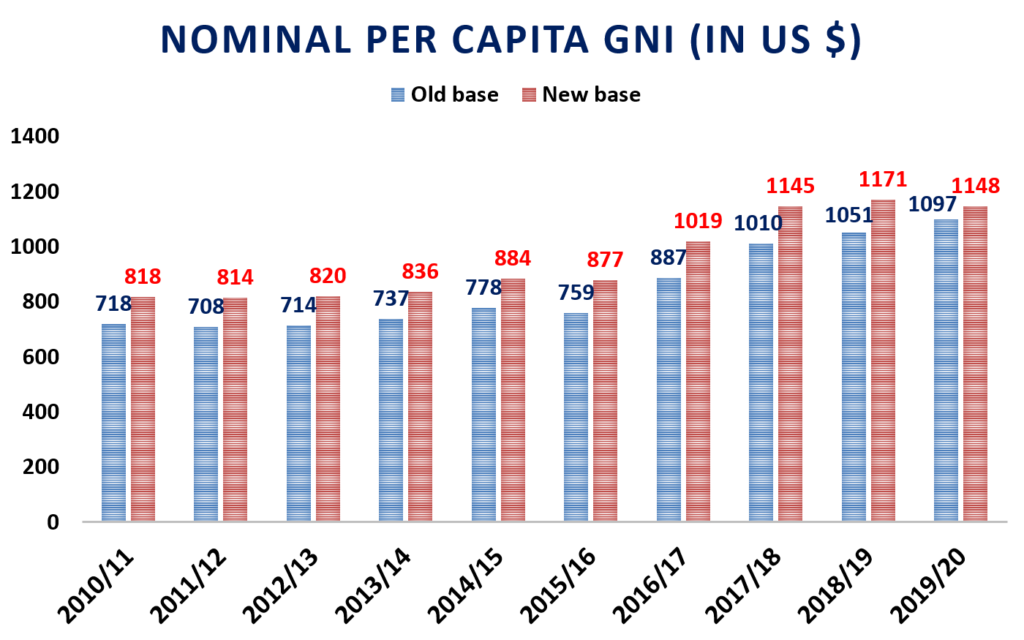
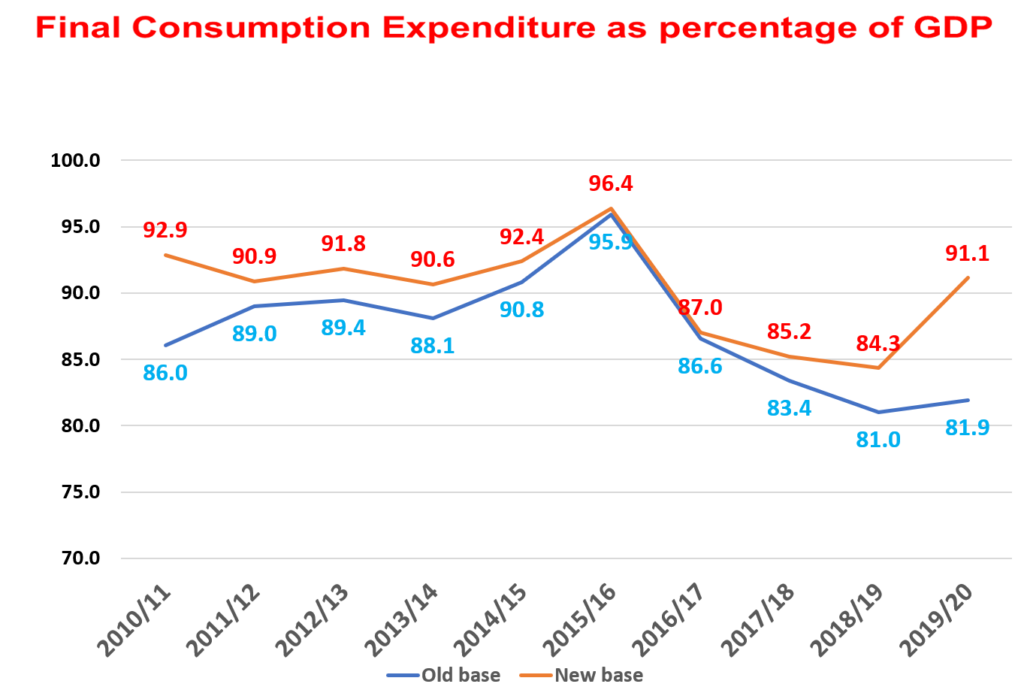
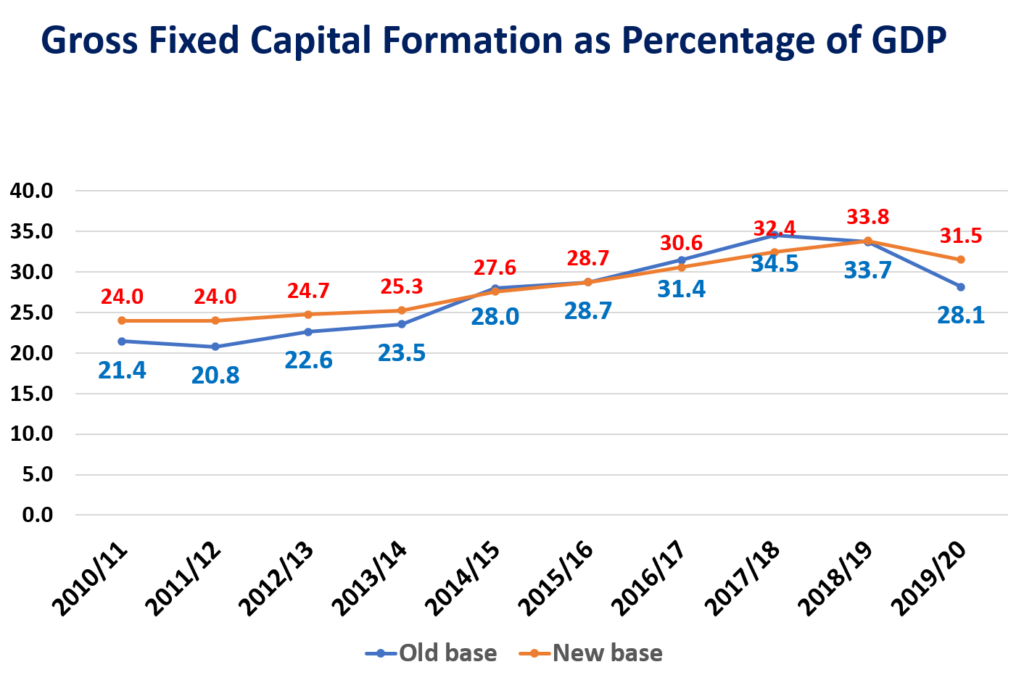
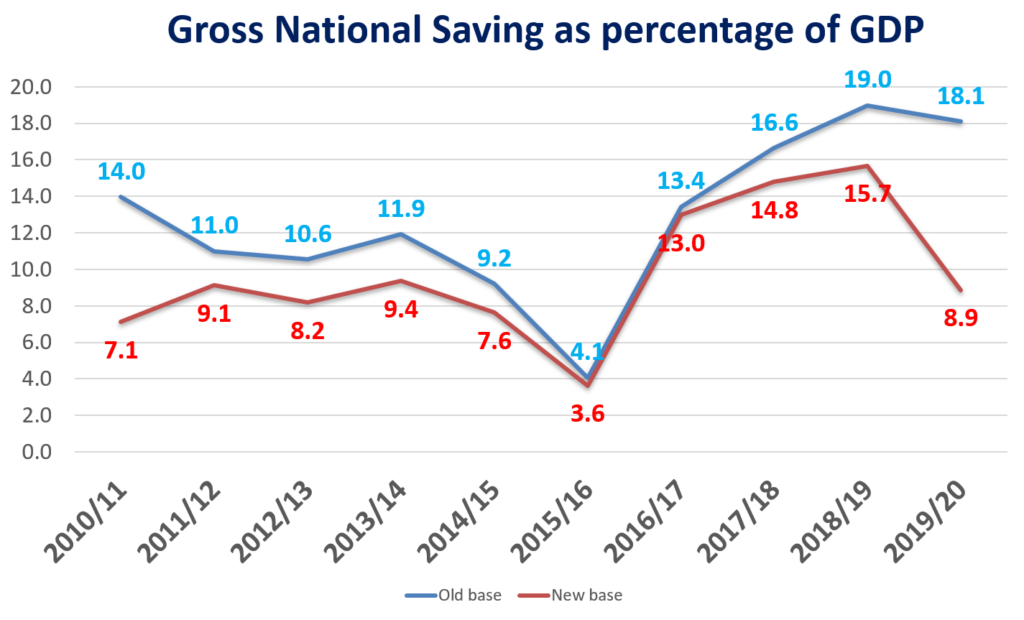
Similarly, the following graphs show the change in nominal per capita GNI, per capita GNDI, final consumption expenditure to GDP ratio, Gross national saving to GDP ratio, tax revenue to GDP ratio, and gross fixed capital formation to GDP ratio.
Change in Composition of GDP
Rebasing of NAS, the composition of GDP as primary, secondary, and tertiary sectors for the GDP of FY 2010/11 brought some changes in comparison to its measure based on the old base year. The contribution of primary (agriculture) sector and secondary (manufacturing and process) sector drooped by 9.5 percent and 3.2 percent respectively. However, the contribution of the tertiary (service) sector surged by 8.4 percent. The following figure shows the changes in the composition of GDP in percentage terms for FY 2010/11.
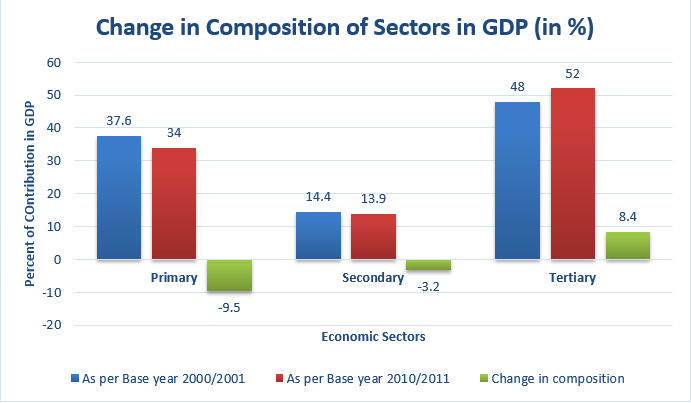
As shown in the above figure, the new share or contribution of the primary sector is 34 percent, secondary sector is 13.9 percent and tertiary sector is 52 percent in FY 2010/11 after rebasing.
Image Sources: Central Bureau of Statistics, Nepal Economic Forum